
Measured SEO data is what Google Search Console, Google Analytics 4 and your own systems record about real searches and visits. Estimated data is what an outside tool models from its keyword database, its own rank checks and an assumed share of searchers per position. Say Search Console shows 1,200 clicks for a page and a third-party estimate puts it at 3,600 visits. Both can be honest: one is a count, the other a projection, and telling measured vs estimated SEO data apart keeps them from clashing.
The trouble starts when both numbers land in the same client deck without a label. Someone asks why traffic “dropped by two thirds,” and the next half hour goes to an argument nobody can win. Sorting measured vs estimated SEO data is mostly a habit: know where each number comes from, pick the one that answers the question, and tag it right there. Below we split the two, show why they disagree, give a decision rule, cover the limits of first-party numbers, and finish with a label set for your next report.
What measured vs estimated SEO data means
Measured vs estimated SEO data is a split by origin. Measured data is recorded from real activity on Google search or on your own site: impressions, clicks, sessions, conversions. Estimated data comes from a third-party tool that cannot see your site’s traffic, so it models that traffic from keyword volumes, its own rank checks and assumed shares per position. One describes what happened. The other describes what probably happened.
A third category sits between them. A calculated number is derived by a formula from counted inputs, such as CTR (clicks divided by impressions) or conversion rate (conversions divided by sessions). It is as reliable as the numbers behind it. It still deserves its own label, because a ratio can hide a tiny base: a perfect-looking conversion rate on four sessions says very little.
Measured data: what Google and your own site record directly
Measured data comes from systems that sit on the actual path of a search or a visit. For SEO performance, three sources cover most dashboards:
- Google Search Console: impressions, clicks, CTR and average position for every query and page Google showed your site for.
- Google Analytics 4 (GA4): organic sessions, engaged sessions, engagement rate, key events and conversions, attributed to the organic search channel.
- Your own systems: server logs, form submissions, CRM records and orders. These hold revenue and business outcomes and give insights no SEO tool can see.
All of this is first-party data. It has gaps, which we cover further down, but nobody guessed it. If Google’s performance data says a page earned 1,200 clicks in September, Google counted them, minus whatever its privacy filters held back.
Estimated data: what third-party tools model
Estimated data comes from tools such as Semrush and its peers, which build their own picture of Google from the outside. They keep a database of keywords with modeled monthly search volumes and run ranking checks for those keywords from their own servers. Then they multiply volume by an assumed click share for each position. The output looks precise: estimated traffic, a visibility score, keyword counts, a traffic value in dollars.
None of it comes from your site. A tool can estimate traffic for a domain it has never had access to. That is exactly why it is useful for competitors and exactly why it is weak for judging your own results. It also knows only the keywords in its database, so long-tail queries and new phrasings are often missing entirely.
Where backlink, authority and ranking numbers fall
Link and ranking figures are where decks blur the line most, because they come from both kinds of source. The table below sorts the common SEO metrics by origin and gives each one a label.
| Metric | Typical source | Label | Why |
|---|---|---|---|
| Clicks, impressions | Google performance report | Measured | Counted by Google |
| CTR | Google performance report | Calculated | Clicks divided by impressions |
| Average position | Google performance report | Measured, averaged | One number hides a spread of positions |
| Rank tracker position | Paid rank tracker | Measured sample | One check, one location, one device, one moment |
| Organic sessions, conversions | GA4 | Measured | Recorded on your site, subject to consent and tagging |
| Backlink count | Third-party crawler | Estimated | Only the links that crawler found |
| Authority score | Third-party tool | Calculated from estimates | Proprietary formula on the tool’s own link index |
| Estimated traffic, visibility score | Third-party tool | Estimated | Modeled from volume, rank and click curves |
| Keyword search volume | Third-party tool | Estimated | Modeled, rounded and averaged over months |
Ranking needs the most care. A position is real evidence that your page appeared, but it says nothing about how many people saw it or clicked. Treat ranking as context for your KPIs, never as a KPI that proves traffic or business value on its own.
Authority scores from Moz, Ahrefs and similar sources are proxies. They are useful for comparing sites, but they are not Google metrics, and chasing them instead of the signals behind them is misaligned effort. Put authority scores in the estimated or context block of the document, and never use one as a KPI.
Why estimated traffic and measured clicks disagree
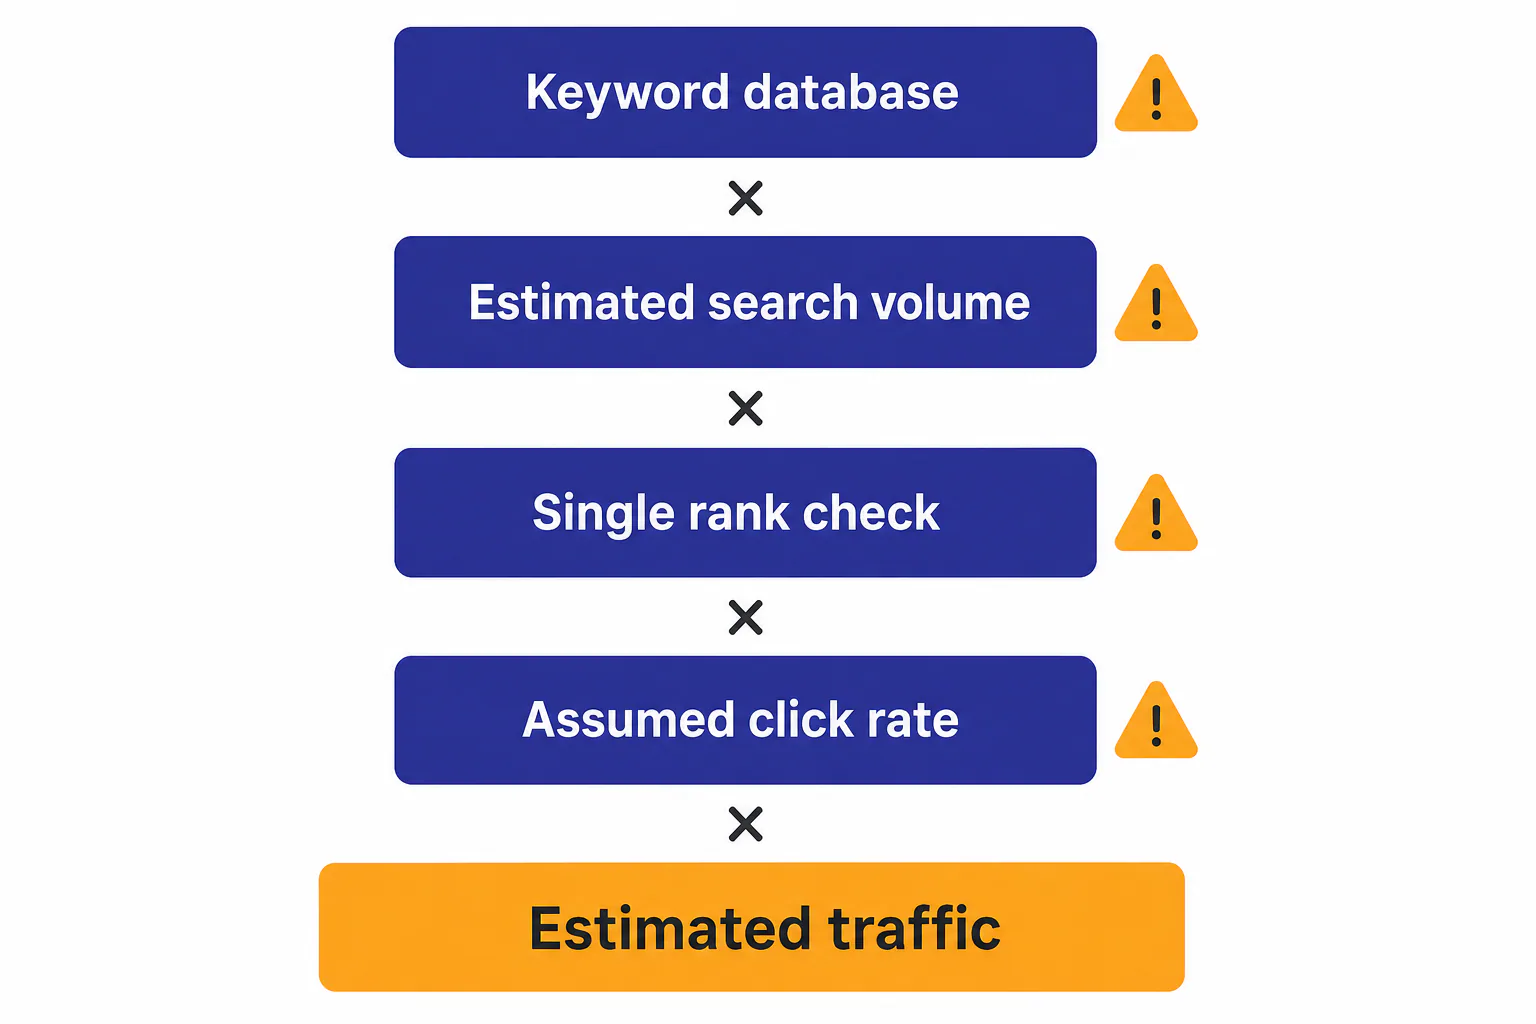
They disagree because they are different metrics built from different inputs. Search Console counts the clicks Google actually delivered. A tool’s organic traffic figure multiplies its own volume guess by its own rank check by an assumed click-through rate. Each of those three inputs can be off, and the errors multiply rather than cancel.
How tools build a traffic estimate
Most tools follow roughly the same recipe, even when the details are proprietary:
- Take the keywords the page ranks for in the tool’s own crawl.
- Attach a modeled monthly search volume to each keyword.
- Check the page’s position for each one from a single location and device.
- Apply a click curve: an assumed share of searchers who click each position.
- Add up the results and state the total as estimated monthly traffic.
Each step has a weak spot. Volumes are averaged across the year, so a seasonal query looks flat. A single rank check misses how position moves by city, device and day. A generic curve ignores the results page: an AI overview, ads, a video row or a map pack can cut clicks sharply at the same position. Brand searches break the curve the other way, since people choose a brand’s own site far more often than any average assumes. Each vendor also tracks only its own keyword set, so other queries do not exist for it.
A worked example: one page, two numbers
The numbers below are illustrative rather than from a real client, but the pattern is one you will recognize. Take a guide called “invoice templates for freelancers” on a B2B software site, over one month.
Search Console shows 41,000 impressions and 1,200 clicks at an average position of 6.4 across 380 queries. The calculated CTR is low, under three clicks per hundred appearances. GA4 shows 1,050 organic sessions landing on the page and 18 trial signups, which are the leads this page exists to produce.
The keyword tool shows 3,600 estimated visits. It found 25 keywords for the page, placed the main one at position 2 with an estimated 8,100 monthly searches, and applied its click curve. The gap comes from four places:
- Position. The tool saw position 2 in one check. Google averages every impression, including the many where the page sat between 5 and 9 on mobile.
- Results page layout. The main query shows an AI overview and a template carousel above the organic results, so the real CTR at position 2 is far below its curve.
- Volume. The 8,100 figure is itself a model, and the page’s own impressions for that query suggest lower demand this month.
- Coverage. It knows 25 keywords, while Google showed the page for 380. The extra queries bring few clicks each, so they do not close the gap, but they show it is looking at a different page than Google is.
Against 1,200 clicks, the 1,050 sessions are a separate, smaller gap. Not every click becomes a recorded session: consent banners, blocked scripts and visitors who leave before the tag loads all cost a few. That gap is first-party against first-party, and it is normal.
Which number to trust for which question
Trust the number whose source can actually see what you are asking about. Here is a quick map from question to metric:
- “Did our visits from Google go up?” Search Console clicks, compared over equal date ranges.
- “Did those visitors do anything?” GA4 engagement and conversions, plus leads from your CRM.
- “Is non-brand demand growing?” Impressions and traffic with brand queries filtered out.
- “How big is this competitor’s organic footprint?” The tool’s estimated traffic and keyword counts, labeled as estimates.
- “How much could a new topic bring?” Estimated volumes, checked against impressions you already get for related queries.
For your own site, the estimate is never the tiebreaker. Organic traffic from GA4 sessions is measured, while a tool’s organic traffic figure is estimated. When they disagree, the first-party number wins, and the gap becomes a question about the model rather than your performance. It should never decide what goes into your KPIs.
A decision rule for choosing measured or estimated data
Use measured data whenever the number describes your own site and someone will make a decision with it. Use an estimate only when no first-party number exists for the question, and label it as one. That single rule settles most disputes, because the cases with no first-party numbers are few and easy to spot: other people’s sites, keywords you do not rank for yet, and the future.
When an estimate is good enough (competitor research, early-stage sites, topic sizing)
Estimates earn their place where the alternative is no number at all.
- Competitor research. You will never see a competitor’s own analytics. Estimated traffic, keyword overlap and ranking spread are the only way to compare. They work well for relative questions: is competitor A roughly twice the size of B, and which topics do they cover that you do not?
- Early-stage sites. A new site has few impressions and no history. Estimated volumes are the best guide to which keywords deserve a page until Google starts showing yours and the first real insights arrive.
- Topic sizing. Choosing between two content clusters means comparing rough magnitudes. An estimate is fine for ranking options against each other, even when its absolute numbers are off.
The common thread is that the estimate is used to compare or prioritize, not to announce a result. Being off by half rarely changes which of two topics is bigger. It changes everything if the same number goes onto a results slide.
When only measured data will do (client updates, budget decisions)
Anything that reports results, sets a target or moves money needs first-party numbers behind it.
- Client reports and leadership updates. Monthly summaries of SEO performance should rest on Search Console clicks and impressions, GA4 organic sessions and conversion counts, and leads or revenue from the CRM where you can connect them.
- Budget decisions. Whether to keep paying for content on a site, or to move budget between sites, should depend on what Google search actually delivered.
- KPIs. Metrics describe activity, but a KPI has to be a metric you can recheck next month from the same source. An estimated visibility score can change because the tool updated its database, which makes it useless as a KPI.
If a client insists on seeing a third-party score, put it in a clearly marked “market context” block, separate from the results.

Free first-party data or paid tools: what each can answer
You can measure SEO success without paid tools, as long as the question is about your own site. Free tools cannot answer questions about the market around you, though. The table shows which questions each side can answer.
| Question | Free first-party (Search Console, GA4) | Paid third-party tool |
|---|---|---|
| How many clicks and impressions did we get? | Yes, counted | Only an estimate |
| Which queries bring our traffic? | Yes, minus hidden queries | Partly, only keywords in its database |
| Do organic visitors convert? | Yes, once conversion tracking is set up in GA4 | No |
| How do we compare with competitors? | No | Yes, estimated |
| How much demand exists for a new topic? | Only for queries you already appear for | Yes, estimated volumes |
| Who links to us? | A sample of links | Yes, from its own crawl |
| Where do we rank today in a given city? | Average position only | Yes, with a local rank tracker |
Free first-party data covers the results side in full. Paid tools add insights about competitors, demand you have not reached yet, and links. That research is where they earn their cost, not in your reports.
The limits of measured data
Measured data is reliable about what it records, but it does not record everything, and it keeps history only for a limited time. Knowing the gaps in measured vs estimated SEO data keeps you from overtrusting your analytics the way people overtrust estimates.
Search Console retention and year-over-year checks
Search Console’s performance report keeps about 16 months of data. Older days then drop off. A year-over-year comparison is therefore possible only for the most recent few months, and a two-year view is impossible unless you saved the numbers yourself.
The fix is a monthly export. On the first working day of each month, pull clicks, impressions, CTR and position by page and by query for the previous month, and store them in a sheet or database. This answers the question of how far back Search Console data goes: about 16 months, so save the rest yourself. For year-over-year change, compare the same calendar months with the same day count and note any major Google update or migration. GA4 has its own retention setting for exploration data, so check the analytics property settings.
Sampling, delays and hidden queries
Several parts of first-party data are incomplete by design:
- Hidden queries. Google withholds rare queries for privacy, so the clicks in the query table add up to less than the page total. The difference is real traffic you cannot track to a keyword.
- Row limits. The interface shows a limited number of rows per table, so large sites need the API or the bulk export to see the long tail.
- Delays. The most recent days are incomplete and fill in later. A report pulled on the 2nd of the month can understate the last days of the month before.
- Averaged position. Average position is weighted by impressions. It can worsen because the page started appearing for new, deeper queries, which is good news that looks like bad news.
- Analytics gaps. Google Analytics 4 misses visitors who decline cookies or block scripts, and it can apply thresholds that hide small segments, which also skews engagement figures for low-traffic pages.
A brand versus non-brand split is itself an estimate. Applying a query filter drops anonymised queries from the data, so the split never covers all traffic. Label brand and non-brand splits as estimates in measured vs estimated SEO data reporting, and state the share of clicks the split covers.
None of this turns first-party numbers into estimates. It means each one needs its source and date range next to it, plus a short note when a known gap affects it.

Reading falling clicks against stable impressions in the age of AI answers
When impressions hold steady and clicks fall, the page is still being shown, but fewer people need to click. That pattern points to a change on the results page, such as an AI overview answering the query, rather than a ranking loss. Check it in three steps before you start optimization work on a page that may not have lost anything:
- Compare average position for the affected queries. If it is stable, ranking is not the cause.
- Split brand and non-brand queries. Brand traffic usually holds up, while informational non-brand queries are where AI answers take clicks.
- Look at conversions per session in GA4. Fewer but better-qualified visits can leave leads flat even as traffic drops.
This is also the first-party answer to “is SEO dead now with AI?” Stable impressions show your visibility in search is intact. A falling CTR shows how much of that visibility still turns into visits. SEO still decides whether you are shown at all, so judge SEO performance on impressions and conversions alongside traffic, and stop treating clicks as the only proof of value.
How to label numbers in a client or team report
Label every number by its origin, right where it appears: measured, estimated or modeled forecast, with the source and date range beside it. This habit makes measured vs estimated SEO data obvious at a glance. It costs a few words per chart and removes the most common argument in SEO reporting.
A simple label set: measured, estimated, modeled forecast
Three labels cover almost all SEO metrics in a report. We also mark calculated ratios separately; in a client deck they can sit under “measured” with the formula shown.
| Label | What it means | Examples | Can it be a KPI? |
|---|---|---|---|
| Measured | Counted by Google or your own systems | Clicks, impressions, organic sessions, conversions, revenue, plus ratios such as CTR and engagement rate | Yes |
| Estimated | Modeled by a third-party tool from outside your site | Competitor organic traffic, keyword volume, visibility score, backlink counts | No, context only |
| Modeled forecast | Your own projection from stated assumptions | Expected clicks after a content push | Only as a target with a range, never as a result |

Where to put the source, date range and confidence note
Put the label on the same line as the number, not in an appendix nobody opens. A consistent format works best:
- In a sentence: “Organic clicks: 1,200 (measured, Google Search Console, Sep 1-30, 2026).”
- On a chart: the source and period in the subtitle, and the label as a small tag in the corner.
- Table or monitoring sheet: a “Source” column and a “Type” column, so measured and estimated rows can be filtered apart. This matters most if you track several sites in one sheet.
Add a confidence note only when something lowers trust in a first-party number, such as a tracking change in your analytics, a migration or a known delay. One sentence is enough: “The GA4 tag was missing from the blog Sep 3-6, so sessions and engagement for those days are undercounted.” For estimates, the label itself is the confidence note.
How to word an estimate so it is not read as actual visits or revenue
The wording should make it impossible to read an estimate as real visits or money. Three habits do most of the work:
- Name the tool and use the verb “estimates”: “The keyword tool estimates about 3,600 monthly visits to this page.”
- Round the figure and give a range where you can, because false precision reads as a count.
- Say what it is not: “This is a modeled figure, not a count of visits, and it says nothing about your revenue.”
Be strictest with traffic value in dollars. A tool’s “traffic cost” is what the same clicks would cost as ads at estimated bids. It is not money the site earned, and it should never sit next to real revenue on a slide.
Labeling forecasts and traffic predictions
A forecast is the one place where you mix first-party and estimated inputs on purpose, so it needs the most visible label. To make SEO traffic predictions that hold up, build them from your own baseline:
- Start from the clicks and impressions the page or query group earned over the last few months.
- Pick a target position and look up the CTR your own site already gets at that position, instead of a generic curve.
- Multiply expected impressions by that CTR, and use estimated volume only for keywords you do not appear for yet.
- Give a low case and a high case, and write down every assumption.
- Date the forecast and compare it with real results every month.
Label the result “modeled forecast,” list the assumptions under it, and never let it reappear later as an actual. Monitoring keeps a forecast honest: a monthly log of forecast against real organic traffic shows the client how good your predictions are, and that earns more trust than any single number.
Start with your next report: add a type column, tag every number as measured, estimated or modeled forecast, and move third-party scores into a separate context block. Then set up the monthly export before the retention window takes data you will want next year. RankFlow covers the workflow from keyword research to Search Console analysis in one workspace. Every number in it is labeled as measured, calculated or estimated, so the habit is built in from the start.
Frequently asked questions
How can SEO be measured?
How can SEO be measured?
Measure SEO with first-party data. Search Console gives you impressions, clicks, CTR and average position. GA4 gives you organic sessions, engagement and conversions, and your CRM holds leads and revenue. Compare equal date ranges month over month and year over year, and split brand from non-brand queries. Use third-party estimates only for competitor and market context, labeled as estimates.
Which SEO metrics should I use as KPIs?
Which SEO metrics should I use as KPIs?
Pick KPIs you can recheck from the same first-party source every month and that connect to business value. Good choices are non-brand organic clicks, organic conversions or leads, and revenue from organic search where you can attribute it. Impressions and average position work as supporting metrics that explain changes. Keep estimated scores, such as visibility or authority, out of your KPIs.
Is SEO still relevant in 2026?
Is SEO still relevant in 2026?
Yes, though what it delivers is shifting. Search still decides which pages are shown and which brands appear next to AI answers, and impressions in your own data show that demand. What changes is the click: some queries are now resolved on the results page. Measure SEO by impressions, conversions and lead quality as well as clicks, and expect some informational pages to earn fewer visits per impression.
What is the 80/20 rule in SEO?
What is the 80/20 rule in SEO?
It is the Pareto idea applied to search: a small share of pages and keywords tends to bring most of a site’s clicks and conversions. Do not take the ratio literally. Check it in your own data by sorting pages by clicks and by GA4 conversions, then put most of your optimization time into updating and protecting those top pages before you write new ones.
Can I report estimated competitor traffic to a client?
Can I report estimated competitor traffic to a client?
Yes, as long as it is labeled and kept apart from the client’s own results. Name the tool, call the figure an estimate, round it, and present it as relative context (“roughly twice our size”) rather than an exact visit count. Never put it in the same chart as the client’s measured clicks, and never use it to claim that anyone is gaining or losing revenue.